The Problem
Revenue, vendor costs, access fees, taxes, overhead, and profitability needed to be analyzed at company, client, salesperson, and order level.
What I Designed
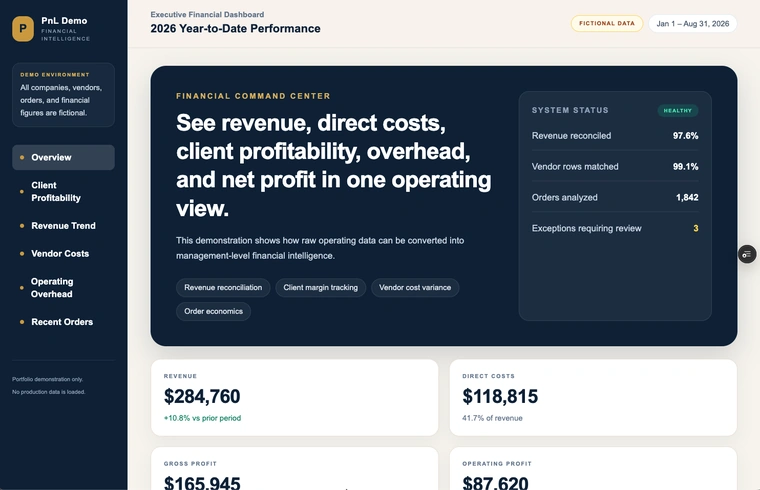
A practical management dashboard that turns imported operational data into useful profitability views and drill-down reporting.
How AI Was Used
- Data model design
- Calculation logic
- Dashboard design
- Coding
- Debugging
- Report design
What Was Built
- Company P&L
- Client-level P&L
- Salesperson P&L
- Client and order drill-downs
- CSV import
- Custom reporting periods
- Print reports
- Backup and restore
Challenges
- Normalizing imported financial data
- Keeping calculations consistent across reporting levels
- Making detailed data usable for management decisions
Outcome
- Centralized profitability reporting
- Made client and order economics easier to inspect
- Created a repeatable internal analysis workflow
Screenshots